Brussels Cycling Potential
Comparing Open Data trips to predicted trips.
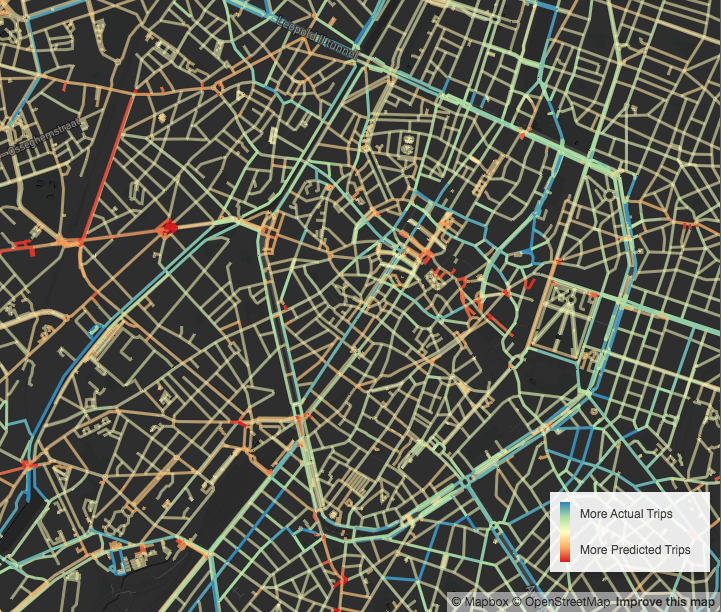
In this map I try to find out which streets in Brussels are under- or over-used by cyclists. I do this by comparing the actual trip count on each road segment to a predicted count.
I hope this map, or a similar exercise, could help city officials and traffic managers identify issues and/or usage potential: which potentially useful roads seem to be avoided, and why? Are there any unexpected routes taken? How could we improve our infrastructure along these routes? Etc.
I use the BikeDataProject ‘bicycle count dataset’ for the actual count. I must note that this dataset is still relatively small, and probably skewed towards recreational, affluent bikers living in the richer part of town (center, South and East).
To estimate the predicted usefulness of each road segment, I use the so called betweenness centrality measure for graphs (like a street network in our example). The algorithm for this measure computes the shortest path between every pair of graph nodes (these nodes are our road crossing) and keeps count of how many times those paths pass through each node, to arrive at some measure for node importance. I carried this resulting count over to the graph edges (our street segment) that are touching each node, and apply some local averaging to arrive at a predicted trip count.
Some first observations include over-usage along the canal and in parks, on some of the main lanes and in the East of town. I also observe notable under-usage of some apparent shortcuts and unsafe or hilly main lanes.
What do you observe?
— @ Home in Brussels, 2021