Hi, I'm Manuel.
As a kid I’ve always loved flipping through atlasses and reading maps – and the kid in me still loves this so much! It taught me to think abstractly and understand spatial relations. Today, I’m happy I can put this knowledge – and love – to use in my work.
How I can help you
I make interactive and printed maps
You have a lot of data and want to show it on a map? I use state-of-the-art tools to visualise your data as a static (printable) map or interactive (web-based) map. Together, we find the right balance between telling a story and making your data explorable.
Layer by layer, I carefully build up your map, complementing your data with Open Data, satellite imagery and graphs. With an eye for detail I take care of advanced aspects like label placement, relief shading and an accessible color system, all while respecting your visual identity.
I help you make sense of your data
You need to match data in a messy Excel-sheet with some old shapefiles and have no idea (or appetite) getting started? Great, I love to structure information! I carefully clean your datasets, combine them in the right way and make notebook reports on your (spatial) research questions. I can also help you orient in the world of statistical tests, predictive models and Machine Learning and apply the most fitting approach.
In the longer run, I can help you set up a data processing pipeline, enabling things like automated reports, connected databases and APIs.
I make geo-spatial algorithms work for you
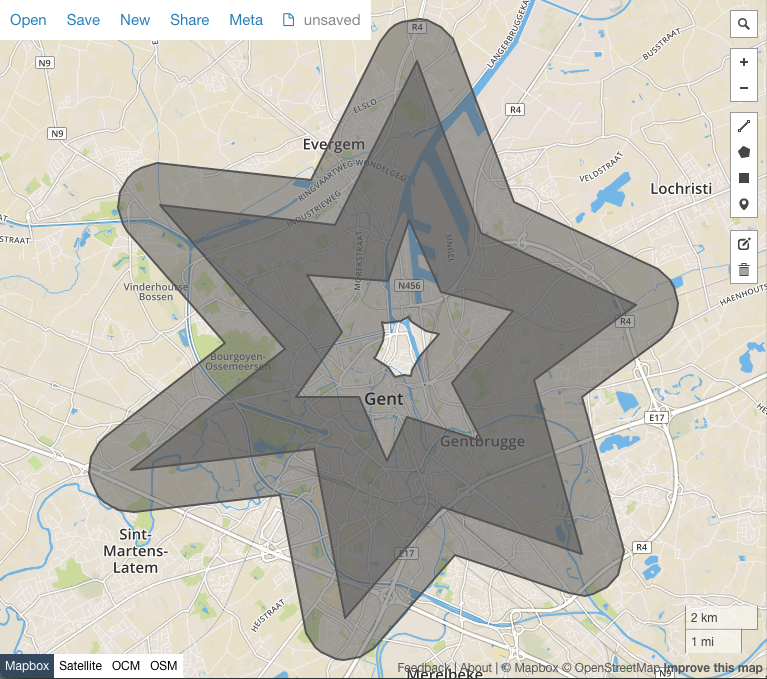
You’re faced with questions like “how many households in this dataset lie within a certain distance of polluting factories” or “what is the shortest route between all these points”? Some incredible geospatial algorithms have been developed for such questions in the fields of computational geometry, geodesy and routing – but sometimes they can be quite scary. I can help you identify the useful ones for your project, implement them and deliver the resulting output, code and documentation.
The engineer in me also looks forward to your remote sensing and hyperspectral image processing challenges.
My work
I try to make maps for projects that matter. My work started off at university, and I love to support researchers big and small with geographic questions in their work, or with representing their findings on a map.
I have a particular interest in historical maps, and currently I’m spending most of my time on the Allmaps project - a open source tool (and spec) that make it easy to work with digitised (historical) maps by georeferencing them, viewing them and enabling them to be easily added to webmaps or QGIS. My contributions started out by implementing Thin Plate Spline transformations and I will hopefully be able to continue to work on some other parts of the stack, especially the ‘Maths that make this all work’. I previously did some other work with historical maps, namely around deformations and styling in historical maps.
I’ve come to know that maps are not just a tool for understanding and planning, but have also been used for (abuse of) power and control. I try to be mindful of this history, learn more about it and question how we can go forward together.
I’m on team Open Knowledge; contributing to OpenStreetMap, using Open Source tools, writing documentation and sharing my own code. I’m inspired by writers and creators pushing for more open and human technology, in the field of GIS and beyond.
For my projects I’ve used tools like QGIS/GDAL – Mapbox GL JS – MapLibre GL JS – OpenLayers – Leaflet – WebGL – JavaScript/TypeScript/Node – SQL/Postgres/PostGIS – R/dplyr – Python/Pandas/Jupyter – CLI – Git – MatLab/Octave.
Some examples
Organisations I’ve worked with include Allmaps, UGent department of Geography, IPIS – International Peace Information Service, Endeavour, Heroes For Zero – 1030/0, ERU – Etudes et Recherches Urbaines, …
Here are some examples of map projects I’ve been involved in. You can click them to explore more – I’ve tried to write what I’ve learned in each of them. I’m happy to share more about my previous projects upon request.
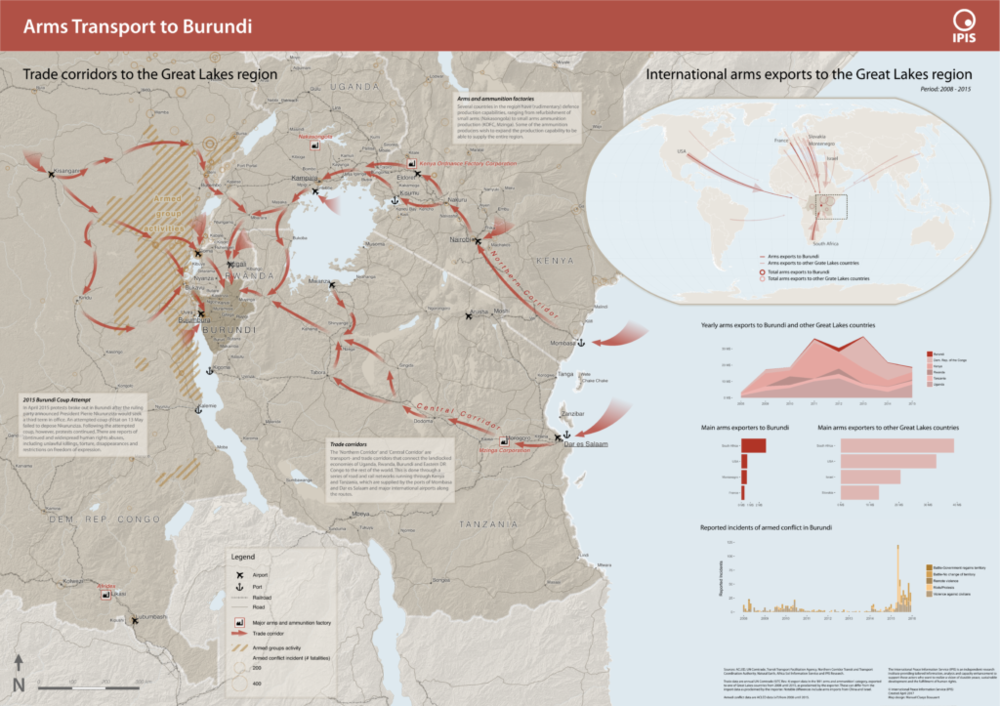
An interactive and a printed map.
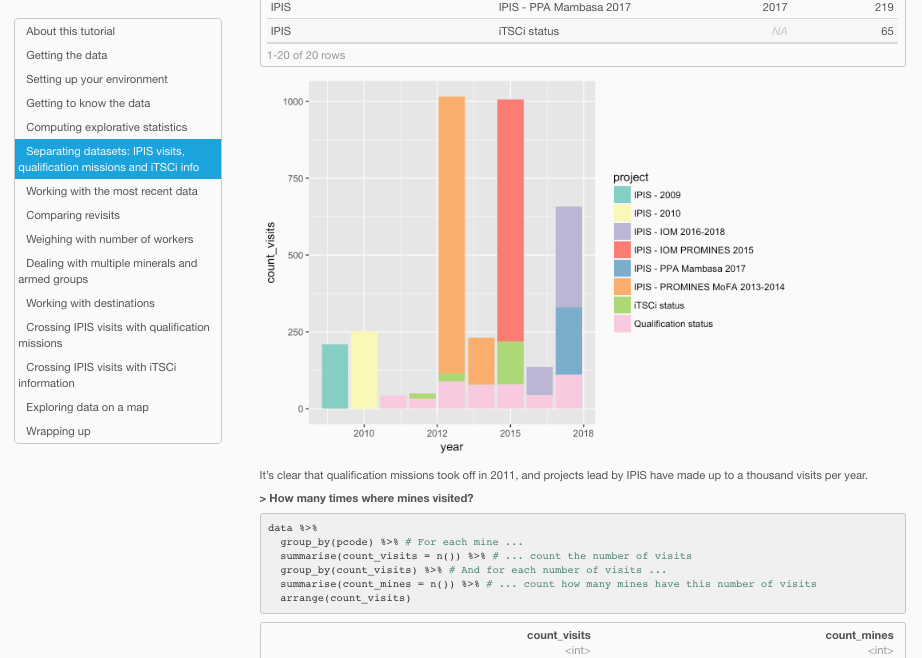
Juggling with and learning from data.
Geo-spatial algorithms for the win.
Background
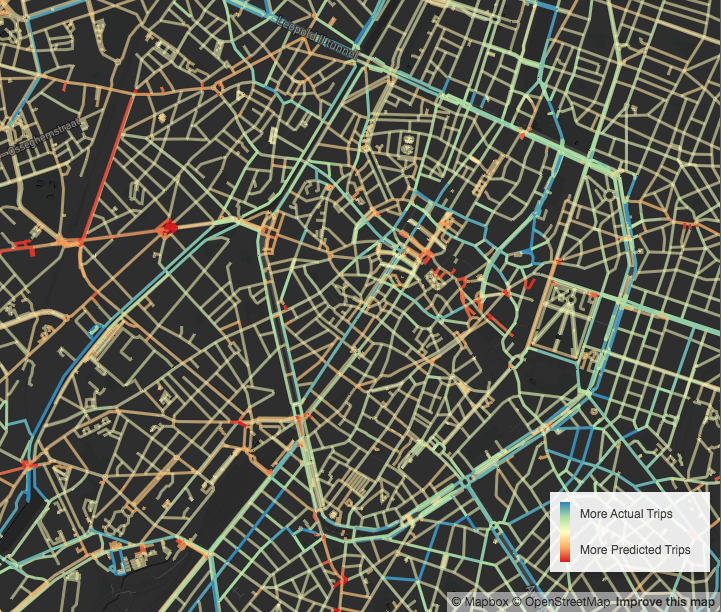
After my studies as an engineer in Applied Physics, I’ve followed by love for maps, Maths and geomatics and worked as a PhD student at the UGent department of Geography working on historical cartography (and their deformations), map projections and predictive algorithms. I later joined an NGO as a GIS-officer and data-scientist, making maps and helping researchers understand their data. I’ve also undertaken some GIS projects in my spare time: building a citizen-driven mobility plan, recreating 18th century map-style and computing the cycling potential of Brussels’ streets.
I’m a human being, too. Proud that I can contribute with some things, also struggling with some others. Trying to be kind and helpful, and to give a place to the many other voices in me too. A person with quite some enthousiasm and belief in our ability to choose and learn and overcome, and moments where these seem further away. And while this website is about me (written for professional reasons - that was a whole exercise!), it’s really about ‘us’, about how we are many and are one, about the power of connection, about recognising who we are – that we are, here and alive in this ‘existence’ thing.
Next to my cartography work, I’m a freelance facilitator: I accompany organizations towards a more cooperative working-together.
Contact
Want to talk more? Great!
Manuel Claeys Bouuaert
Brussels, Belgium
manuel.claeys.b@gmail.com
0485 74 88 11
VAT: BE0747868317 — IBAN: BE45894001120089